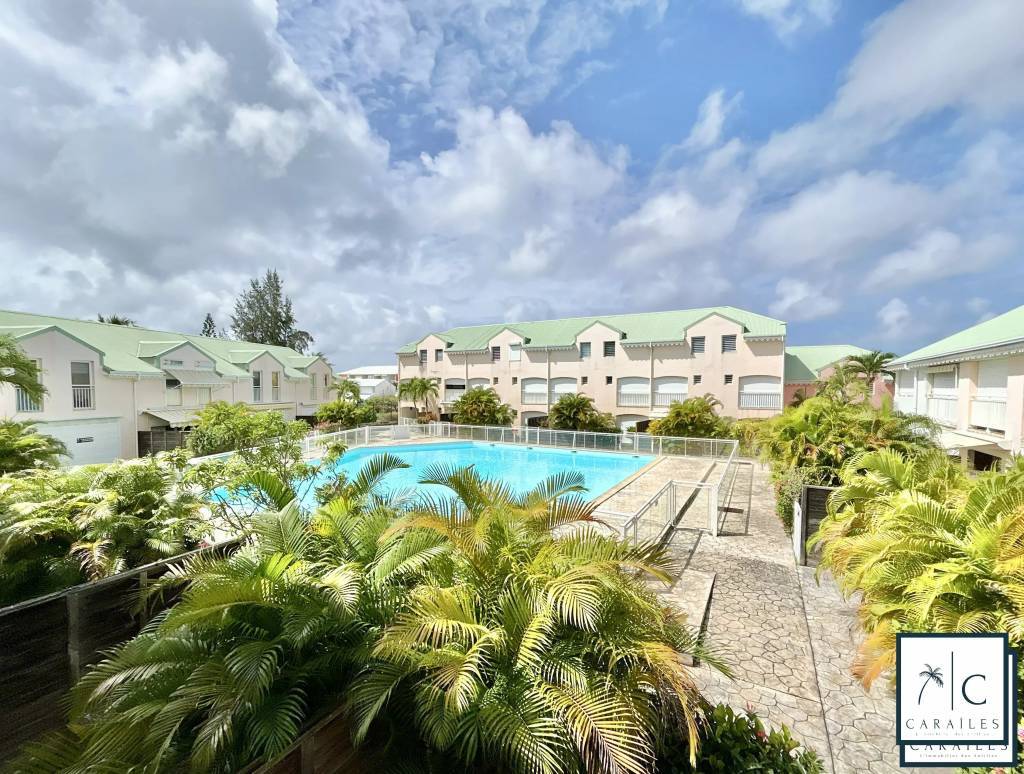
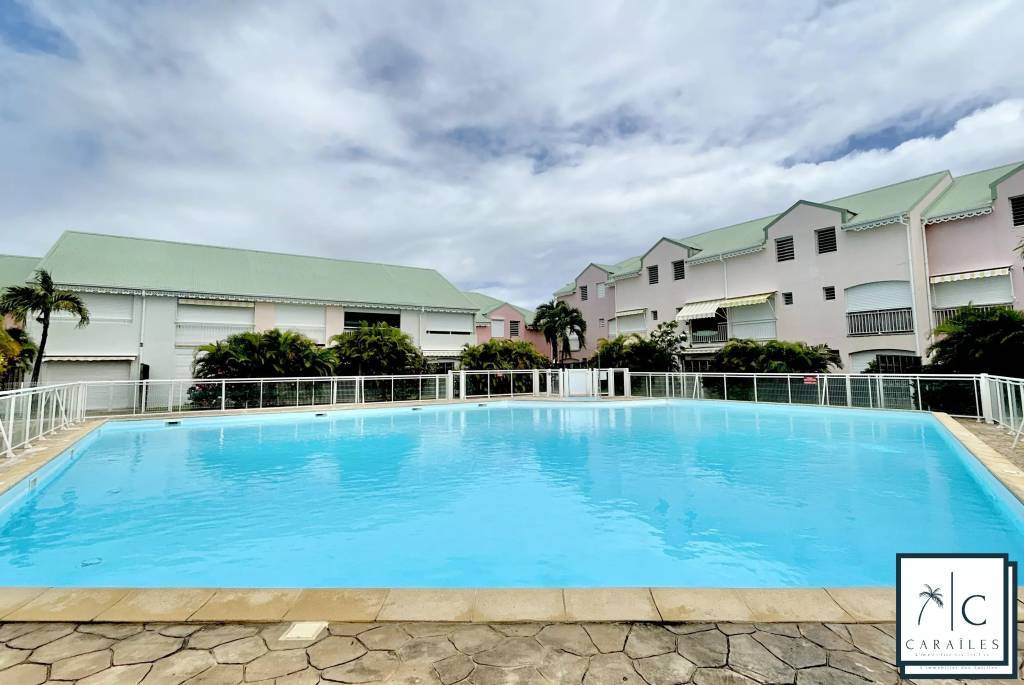
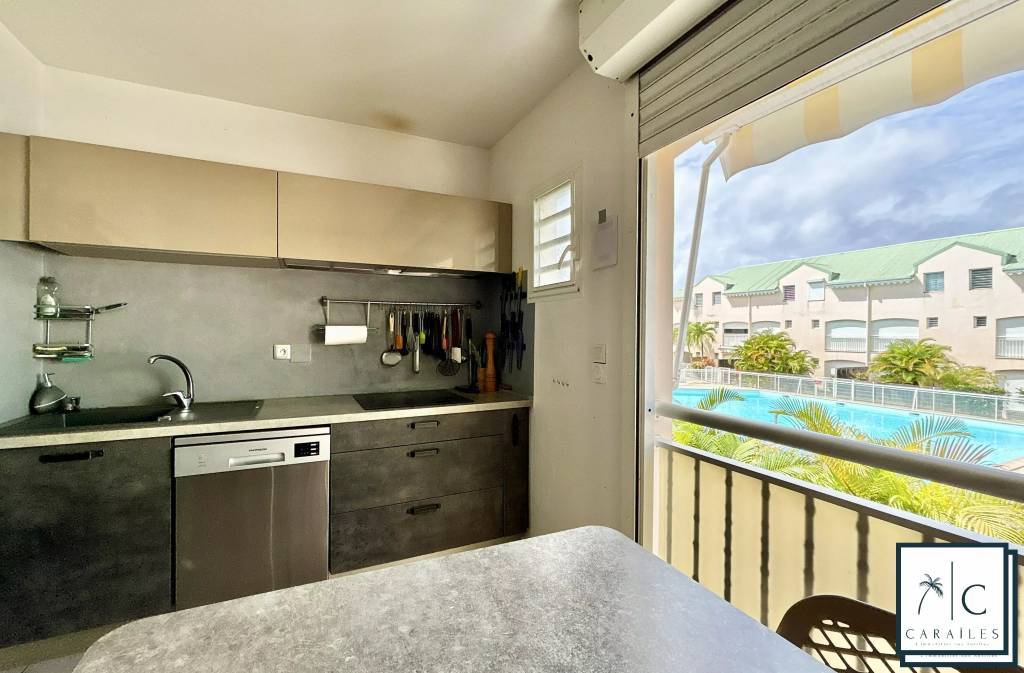
Apartment,
Saint-François
- 3
- 2
- 1
- 65 m²


This barometer presents the real estate price per m² in Martinique, town by town, from sought-after neighborhoods on the south coast — Le Diamant, Les Trois-Îlets, Sainte-Anne, and Les Anses-d'Arlet — to more affordable towns in the North such as Le Prêcheur, Basse-Pointe, and Grand'Rivière, not forgetting the island's economic hub, Fort-de-France. The data comes from DVF (DGFiP) transaction records cross-referenced with our on-the-ground expertise, and is updated quarterly — last updated in August 2026.
An overview of the Martinique property market, municipality by municipality — built from DVF (DGFiP) data and our local expertise.
3 207 €/m² Median price in Martinique | +10% / an 12-month change | 34 Municipalities analysed |
Map built from official municipal boundaries (IGN/GeoJSON). The 5 municipalities circled in dark blue have a dedicated page with the full analysis.
Price level per m² Under €2,200 €2,200 – 2,700 €2,700 – 3,200 €3,200 – 3,700 €3,700 – 4,300 Over €4,300 5 detailed pages available: Fort-de-France, Le Lamentin, Ducos, Les Trois-Îlets et Le Diamant.
|
| Municipality | Average price | Level | Trend (2025 vs 2024)* |
|---|---|---|---|
| Le Diamant | 4 600 €/m² | > €4,300 | ▲ +9,9 % |
| Les Trois-Îlets | 4 400 €/m² | > €4,300 | = +2,3 % |
| Les Anses-d'Arlet | 4 392 €/m² | > €4,300 | — |
| Sainte-Anne | 4 307 €/m² | > €4,300 | ▲ +9,3 % |
| Sainte-Luce | 4 004 €/m² | €3,700 – 4,300 | — |
| Le Marin | 3 830 €/m² | €3,700 – 4,300 | — |
| Le François | 3 310 €/m² | €3,200 – 3,700 | ▲ +5,8 % |
| Le Robert | 3 240 €/m² | €3,200 – 3,700 | ▼ −10,2 % |
| Rivière-Salée | 3 230 €/m² | €3,200 – 3,700 | — |
| Schœlcher | 3 167 €/m² | €2,700 – 3,200 | ▼ −6,5 % |
| Le Vauclin | 3 080 €/m² | €2,700 – 3,200 | — |
| Le Morne-Vert | 3 070 €/m² | €2,700 – 3,200 | — |
| Le Carbet | 3 025 €/m² | €2,700 – 3,200 | — |
| La Trinité | 2 956 €/m² | €2,700 – 3,200 | — |
| Case-Pilote | 2 929 €/m² | €2,700 – 3,200 | — |
| Le Lamentin | 2 900 €/m² | €2,700 – 3,200 | ▲ +7,5 % |
| Fonds-Saint-Denis | 2 890 €/m² | €2,700 – 3,200 | — |
| Saint-Joseph | 2 840 €/m² | €2,700 – 3,200 | — |
| Ducos | 2 800 €/m² | €2,700 – 3,200 | ▲ +13,9 % |
| Fort-de-France | 2 750 €/m² | €2,700 – 3,200 | ▲ +5,9 % |
| Gros-Morne | 2 680 €/m² | €2,200 – 2,700 | — |
| Bellefontaine | 2 600 €/m² | €2,200 – 2,700 | — |
| Saint-Esprit | 2 560 €/m² | €2,200 – 2,700 | — |
| Saint-Pierre | 2 540 €/m² | €2,200 – 2,700 | — |
| Rivière-Pilote | 2 480 €/m² | €2,200 – 2,700 | — |
| L'Ajoupa-Bouillon | 2 400 €/m² | €2,200 – 2,700 | — |
| Sainte-Marie | 2 350 €/m² | €2,200 – 2,700 | — |
| Le Morne-Rouge | 2 290 €/m² | €2,200 – 2,700 | — |
| Grand'Rivière | 2 150 €/m² | < €2,200 | — |
| Macouba | 2 140 €/m² | < €2,200 | — |
| Le Marigot | 2 000 €/m² | < €2,200 | — |
| Le Lorrain | 1 950 €/m² | < €2,200 | — |
| Basse-Pointe | 1 800 €/m² | < €2,200 | — |
| Le Prêcheur | 1 520 €/m² | < €2,200 | — |
* Tendance affichée uniquement pour les communes disposant d'un volume de ventes 2025 suffisant pour être significatif (Fort-de-France, Le Lamentin, Schœlcher, Le Robert, Le Diamant, Ducos, Les Trois-Îlets, Sainte-Anne, Le François). Pour les autres communes, l'échantillon de transactions est trop réduit pour dégager une tendance fiable — aucune donnée n'est donc affichée plutôt qu'un chiffre trompeur.
Ranking limited to municipalities with a DVF sales volume sufficient to establish a reliable trend.
Source: DVF Explorer (DGFiP data, 2025 edition), municipalities with at least 40 recorded sales in 2025.
“This map gives an overall picture, but every neighbourhood — seafront, hillside, town centre — has its own price dynamics.
Indicative data compiled from several specialist sources (cross-checked DVF/DGFiP), updated quarterly. For an accurate valuation of your property, contact our team.”
This site is protected by reCAPTCHA and the Google Privacy Policy and Terms of Service apply.
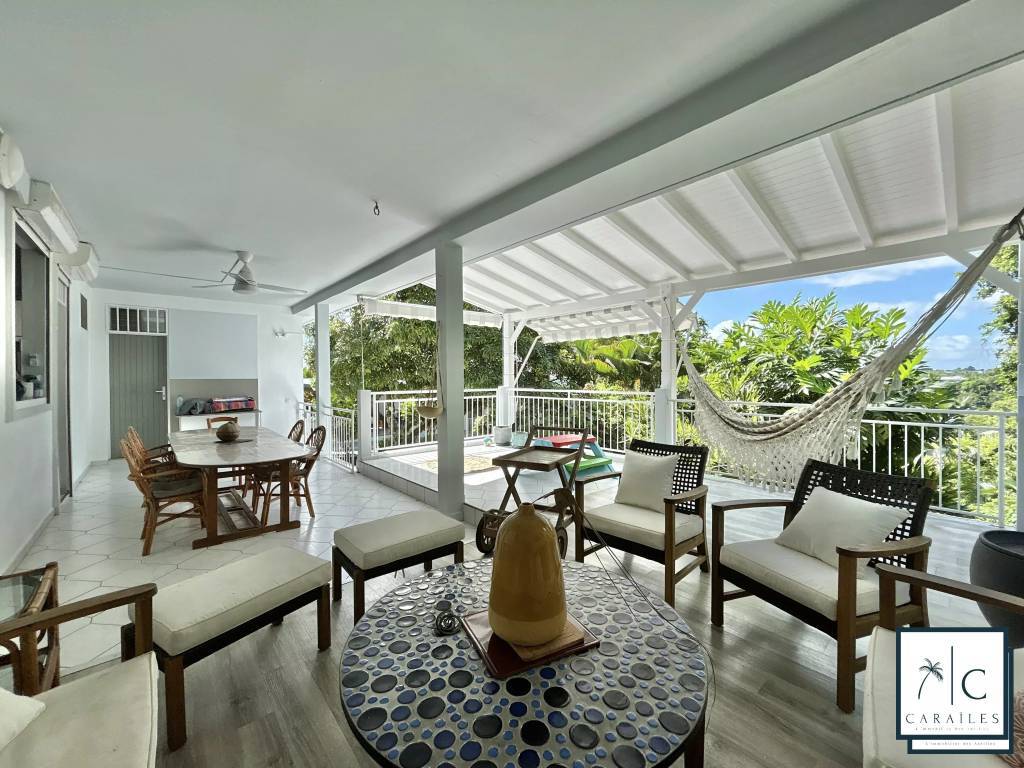
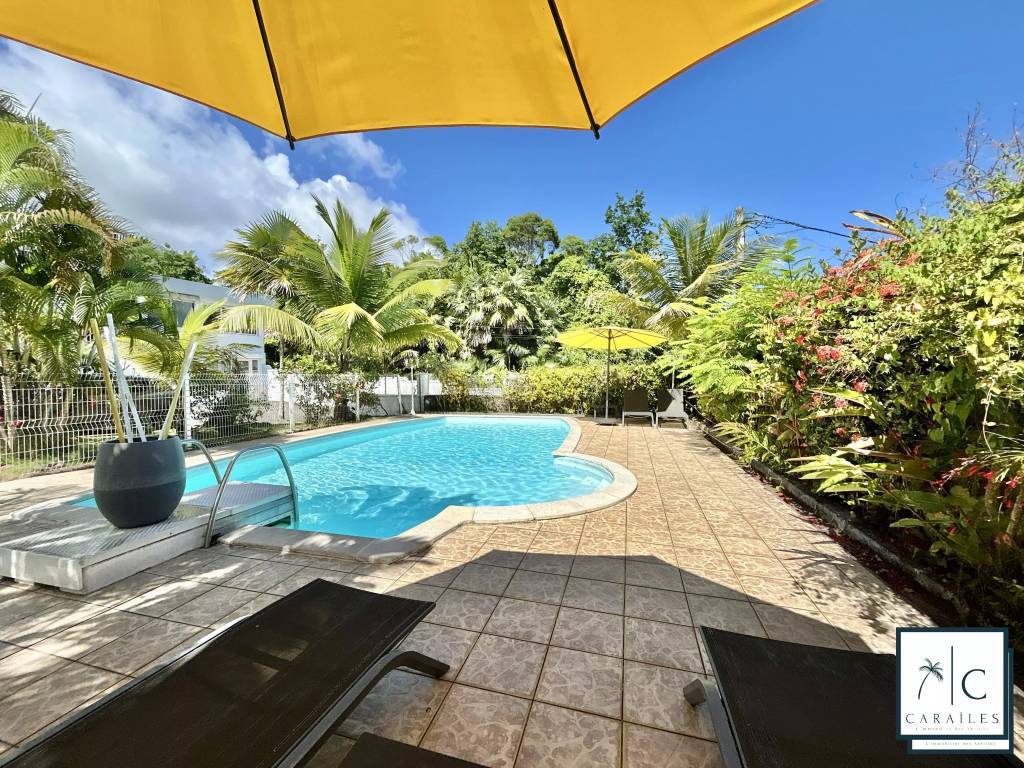
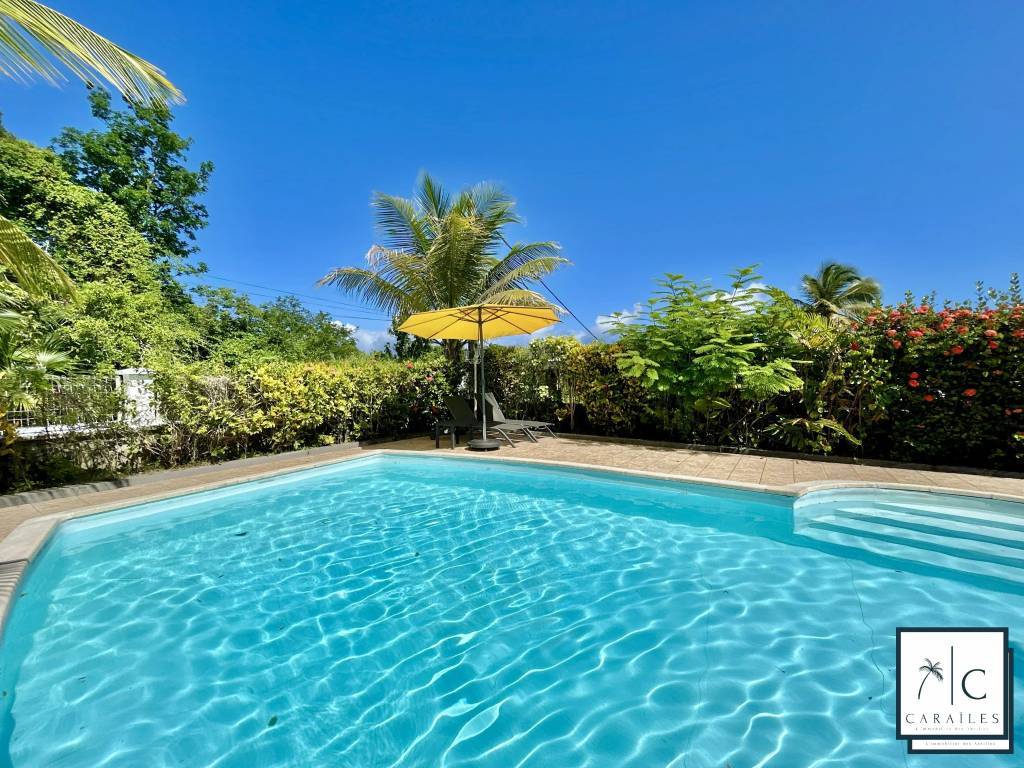
Follow us on Instagram and Facebook to discover our news 24 hours before their official broadcast! Located in the highly sought-after neighborhood...